#optimization # 0, 工具的介绍
Cachegrind User Manual Callgrind User Manual
What can Callgrind do: Cachegrind collects flat profile data:
event counts (data reads, cache misses, etc.) are attributed
directly to the function they occurred in. This cost attribution
mechanism is called self or exclusive attribution.
Callgrind extends this functionality by propagating costs across
function call boundaries. If
function foo calls bar, the costs
from bar are added into foo’s costs. When
applied to the program as a whole, this builds up a picture of so
called inclusive costs, that is, where the cost of each
function includes the costs of all functions it called, directly or
indirectly. As an example, the inclusive cost
of main should be almost 100 percent of the total
program cost. Because of costs arising before main is
run, such as initialization of the run time linker and construction
of global C++ objects, the inclusive cost of main is
not exactly 100 percent of the total program cost. Together with the
call graph, this allows you to find the specific call chains
starting from main in which the majority of the
program’s costs occur. Caller/callee cost attribution is also useful
for profiling functions called from multiple call sites, and where
optimization opportunities depend on changing code in the callers,
in particular by reducing the call count. Callgrind’s cache
simulation is based on that of Cachegrind. Read the documentation
for Cachegrind:
a cache and branch-prediction profiler first. The material below
describes the features supported in addition to Cachegrind’s
features. Callgrind’s ability to detect function calls and returns
depends on the instruction set of the platform it is run on. It
works best on x86 and amd64, and unfortunately currently does not
work so well on PowerPC, ARM, Thumb or MIPS code. This is because
there are no explicit call or return instructions in these
instruction sets, so Callgrind has to rely on heuristics to detect
calls and returns. ## 0.1 pros&cons
**_Precise**._ Cachegrind measures the exact number of instructions executed by your program, not an approximation. Furthermore, it presents the gathered data at the file, function, and line level. This is different to many other profilers that measure approximate execution time, using sampling, and only at the function level.
**_Reproducible**._ In general, execution time is a better metric than instruction counts because it’s what users perceive. However, execution time often has high variability. When running the exact same program on the exact same input multiple times, execution time might vary by several percent. Furthermore, small changes in a program can change its memory layout and have even larger effects on runtime. In contrast, instruction counts are highly reproducible; for some programs they are perfectly reproducible. This means the effects of small changes in a program can be measured with high precision.
Cachegrind’s cache profiling has a number of shortcomings:
bts, btr and btc will
incorrectly be counted as doing a data read if both the arguments
are registers, e.g.:这类热点函数通常来自其他的分析工具,比如perf。 1.1 intel Pt 中哪些类型的函数可以直接优化 - 1.1.1 动态内存分配 - 1.1.2 std::xxx 函数(std::log10,std::pow, std::string, random_engine(),…) - 1.1.3 unexpected memset(来自 c++的zero initialization) - 1.1.4 热点函数(函数在一个区域内反复被调用) - 1.1.5 unused calculateion(计算了半天结果没用到,尤其在于很多feature log的打印中)
1.2 优化方法 - 1.2.1 修改数据结构(不使用有动态内存分配的数据结构,比如std::map, std::vector等等) - 1.2.2 time-space trade-off (查表法来代替计算) - 1.2.3 lazy initialization (使用的时候再计算) - 1.2.4 减少padding - 1.2.5 代码逻辑优化,(减少函数调用, 使用inline) - 1.2.6 算法优化(比如bitset能否一次检测多个) - 1.2.7 使用泛型(template传递函数指针,lambda表达式等等) - 1.2.8 减少拷贝(使用引用,reference_wrapper) - 1.2.9 likely() 这个宏定具体做了什么呢,该在什么时候用到它?likely - 1.2.10 打印(打印放到feature log中,打印信息可以在tti trace、bip log里得到) - 1.2.11 implicit consumption( std::function<>作为参数传递有构造和析构的开销, std::optional调用有开销, std::bitset遍历的开销,.at()的开销) - 1.2.12 return early - 1.2.13 编译时计算(constexpr, std::is_same_v, …)
2.1 找到instructs, 消耗最多的函数
callgrind_annotate --show=Ir --sort=Ir --auto=no ./cb8140GJ_BasePcellAsSUT-2CC_TDD500_TDD500_SA_InterCA-0-0.callgrind.log | grep -vE "sm6-snowfish-dynamic-linker-on|tickler|glibc|generated|cpp_testsuites|\?\?\?" >ir.callgrind.txt2.2 找到cachemiss 最多的位置 2.2.1 data cache miss
callgrind_annotate --show=Ir,D1mr,D1mw --sort=Ir,D1mr,D1mw --auto=no ./cb8140GJ_BasePcellAsSUT-2CC_TDD500_TDD500_SA_InterCA-0-0.callgrind.log >dcachemiss.callgrind.txt2.2.2 instruct cache miss
callgrind_annotate --show=Ir,I1mr,ILmr --sort=Ir,I1mr,ILmr --auto=no ./cb8140GJ_BasePcellAsSUT-2CC_TDD500_TDD500_SA_InterCA-0-0.callgrind.log >icachemiss.callgrind.txt2.2.3 branch miss
# 首先用annotate过滤出Bc,Bcm,Bi,Bim四个事件 callgrind_annotate --show=Bc,Bcm,Bi,Bim --sort=Bc,Bcm --auto=no ./cb8140GJ_BasePcellAsSUT-2CC_TDD500_TDD500_SA_InterCA-0-0.callgrind.log >annotate.callgrind.txt # 找出和L2-PS相关的函数 cat annotate.callgrind.txt | grep -vE "sm6-snowfish-dynamic-linker-on|tickler|glibc|\?\?\?" > branchmiss.callgrind.txt
2.3 找到调用次数最多的函数 2.4
找到单位时间内消耗最大的函数(instruction, cycles) 2.5
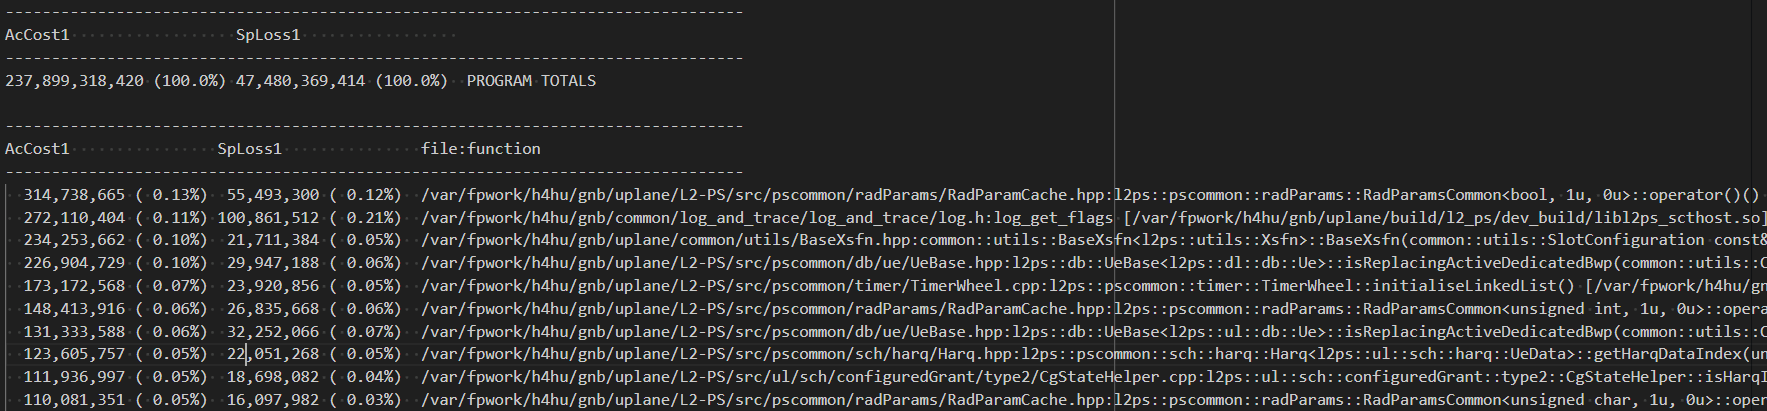
cacheline使用率的统计 cacheline使用率按照 callgrind
accost1指标排序
callgrind_annotate --show=AcCost1,SpLoss1 --sort=AcCost1,SpLoss1 --auto=no ./cb9304_CnpFdd1CellUlDlTraffic-1CC_20UE_FDD1000_CFG_SA_noCA-0-0.callgrind.log > accost1.log

cat accost1.log | grep -vE "sm6-snowfish-dynamic-linker-on|tickler|glibc|generated|cpp_testsuites|\?\?\?" > accost1.callgrind.txt通过修改数据结构,来避免动态内存分配: gerrit.ext.net.nokia.com/gerrit/c/MN/5G/NB/gnb/+/7470162 通过去除std::optional,使xsfn的合法性检查更高效: [CB010482-SR-A-B18_5G_L2_PS] pucchInfo optimization. (Ibc45c2cf) · Gerrit Code Review (nokia.com) 减少不必要的std::string使用 https://gerrit.ext.net.nokia.com/gerrit/c/MN/5G/NB/gnb/+/7560807 ## 2.3.2 time-space trade-off 适当地使用,但并不是所有的查表法都比计算更高效 不用查表法更高效的例子 1,例子 log10查表法 [CB010482-SR-A-B18_5G_L2_PS] enhancement of log10 lookup table. (I8bc239b2) · Gerrit Code Review (nokia.com) 2,{1,1,2,….} log2(x)取整数的计算 …/PdcchCandidateCalculator.hpp · Gerrit Code Review (nokia.com) Quick C++ Benchmarks (quick-bench.com)
1, 变量被真正使用的时候,才调用接口获取变量 [CNI-111721-A-B1_5G_L2_PS] lazy initialization some variables. (I8ea9a83f) · Gerrit Code Review (nokia.com)
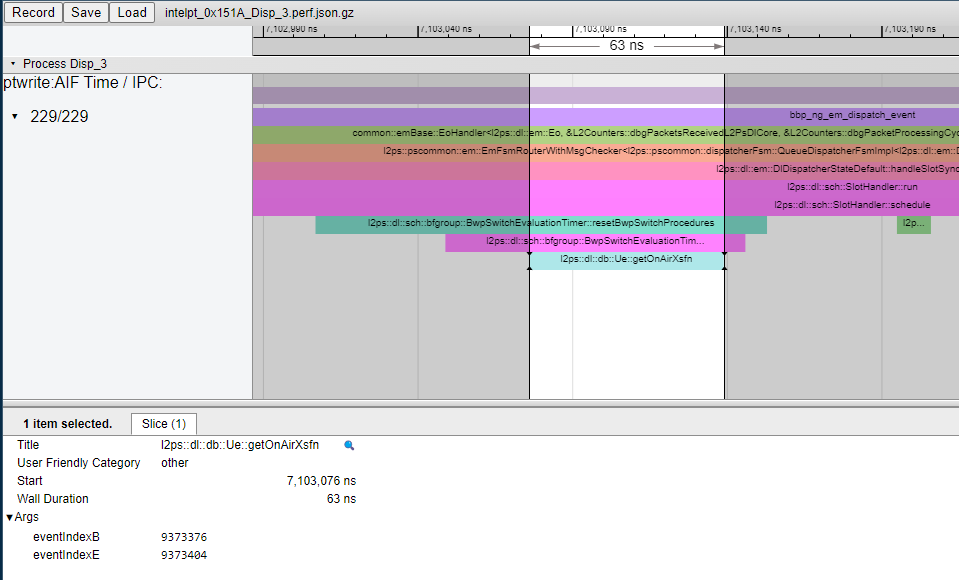
2,feature开关打开时才进行变量的计算
下面这个例子展示了getOnAirXsfn引用变量定义所需要的时间。 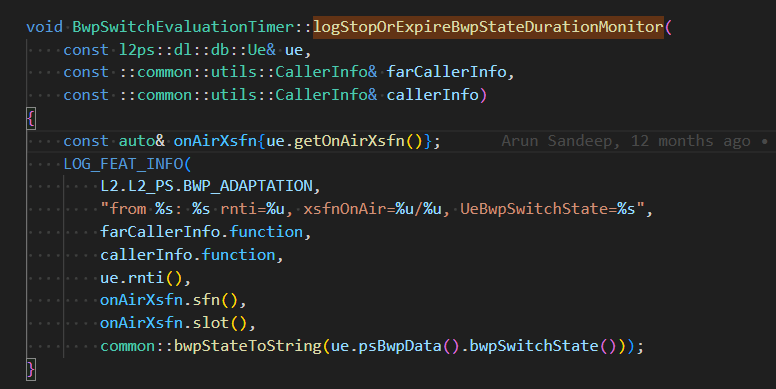
3,当真正用到一个数组的时候,才初始化这个数组 [CB010482-SR-A-B18_5G_L2_PS] Lazy initialization class member. (I64a08878) · Gerrit Code Review (nokia.com)
通常的理解,减少padding可以减少内存的使用,但对于性能而言,padding的减少不一定会影响性能。
以下这个例子显示了减少padding对性能影响,反而减少padding调整了结构之间的顺序,使得访问两个成员需要消耗两条cache line。 Quick C++ Benchmarks (quick-bench.com)
简化sfn(), slot(): [ECERD-52930] optimize sfn() and slot(). (I37fd458e) · Gerrit Code Review (nokia.com) [CB010482-SR-A-B18_5G_L2_PS] Minor fix in calSubcellSize. (I73a532d3) · Gerrit Code Review (nokia.com) [ECERD-52142] remove duplicate comparazation. (I2248b40d) · Gerrit Code Review (nokia.com) ## 2.3.6 算法优化 gerrit.ext.net.nokia.com/gerrit/c/MN/5G/NB/gnb/+/7169768
在for循环中使用reference来遍历 利用RVO特性减少拷贝 使用std::move移动语义 ## 2.3.9 likely() likely
可以在其他类型log中找到的信息,就不用再加打印 [CB010482-SR-A-B18_5G_L2_PS] Delete lack of pdcch print. (I42841a18) · Gerrit Code Review (nokia.com)
https://gerrit.ext.net.nokia.com/gerrit/#/c/7380354 https://gerrit.ext.net.nokia.com/gerrit/c/MN/5G/NB/gnb/+/7380354 CallerInfo优化 ## 2.3.12 return early …/UeData.hpp · Gerrit Code Review (nokia.com)
对于固定的值计算,可以在编译时进行 对于类型的判断,可以在编译时进行 使用模板生成不同的分支代码
Reference: CppCon 2016: Timur Doumler “Want fast C++? Know your hardware!” (youtube.com)